iOS Performance tips you probably didn't know (from an ex-Apple engineer)
If you’d like to stay up to date with articles about Cocoa development and bootstrapping a software business, follow me on Twitter or sign up to the mailing list.

As developers, good performance is invaluable to surprise and delight™ our users. iOS users have high standards, and if your app is sluggish or crashes under memory pressure, they’ll stop using it, or worse, leave a bad review.
I have spent the past 6 years at Apple working on Cocoa frameworks and first party apps. I’ve worked on Spotlight, iCloud, app extensions and most recently on Files.
I have noticed that there was a pattern of low-hanging fruits, where you could make 80% of the performance gains in 20% of the time.
Here’s a checklist of performance tips that would hopefully give you the biggest bang for your buck:
1) UILabel costs more than what you think

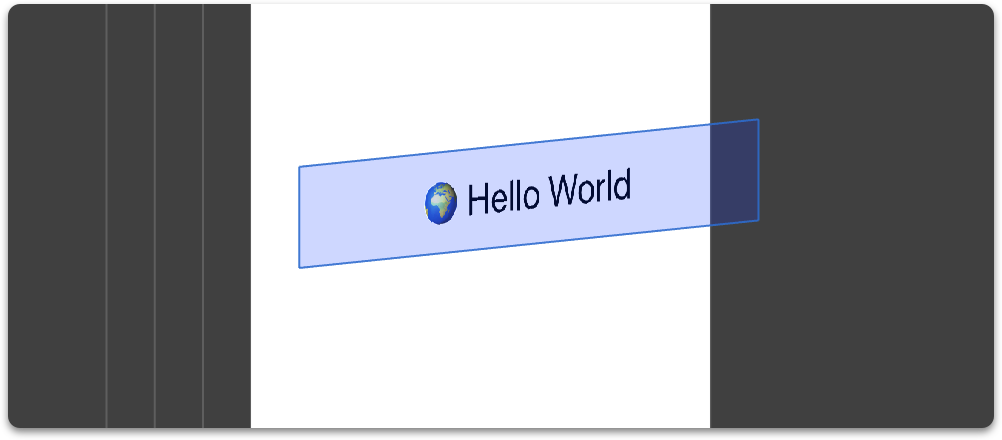
UILabel in the wildWe’re tempted to think of labels as lightweight in terms of memory usage. In the end, they just display text. UILabels are actually stored as bitmaps, which could easily consume megabytes of memory.
Thankfully, the UILabel implementation is smart, and only consumes what it needs to:
- If your label is monochrome,
UILabelwould opt forCALayerContentsFormatofkCAContentsFormatGray8Uint(1 byte per pixel), whereas non-monochrome labels (e.g. to display "🥳it’s party time", or a multi-coloredNSAttributedString) would need to usekCAContentsFormatRGBA8Uint(4 bytes per pixel).
A monochrome label consumes a maximum of width * height * contentsScale^2 * (1 byte per pixel) bytes, and a non-monochrome one would consume 4 times as much: width * height * contentsScale^2 * (4 bytes per pixel).
For example, on an iPhone 11 Pro Max, a label of size 414 * 100 points could consume up to:
414 * 100 * 3^2 * 1 = 372.6kB(monochrome)414 * 100 * 3^2 * 4 = ~1.49MB(non-monochrome)
Edit:
After discussing on Twitter with UIKit engineers, I’m adding a word of caution.
Make sure you always measure first, and only consider the following changes if your performance issue is indeed memory pressure caused by labels.
From UIKit’s @Inferis:
As for the case in point: suppose a future update to UILabel optimizes how it (re)uses backing store, your optimization is now making things (potentially a lot) worse.
A common anti-pattern is leaving UITableView/UICollectionView cell labels populated with their text content when these cells enter the reuse queue. It is highly likely that once the cells are recycled, the labels’ text value will be different, so storing them is wasteful.
To free up potentially megabytes of memory:
- Nilify labels’
textif you set them to hidden and only occasionally display them. - Nilify labels’
textif they’re displayed inUITableView/UICollectionViewcells, in:
tableView(_:didEndDisplaying:forRowAt:)
collectionView(_:didEndDisplaying:forItemAt:)
2) Always start with serial queues, and only use concurrent queues as a last resort
A common anti-pattern is dispatching blocks that don’t affect the UI from the main queue onto one of the global concurrent queues.
For example:
func textDidChange(_ notification: Notification) {
    let text = myTextView.text
    myLabel.text = text
    DispatchQueue.global(qos: .utility).async {
        self.processText(text)
    }
}
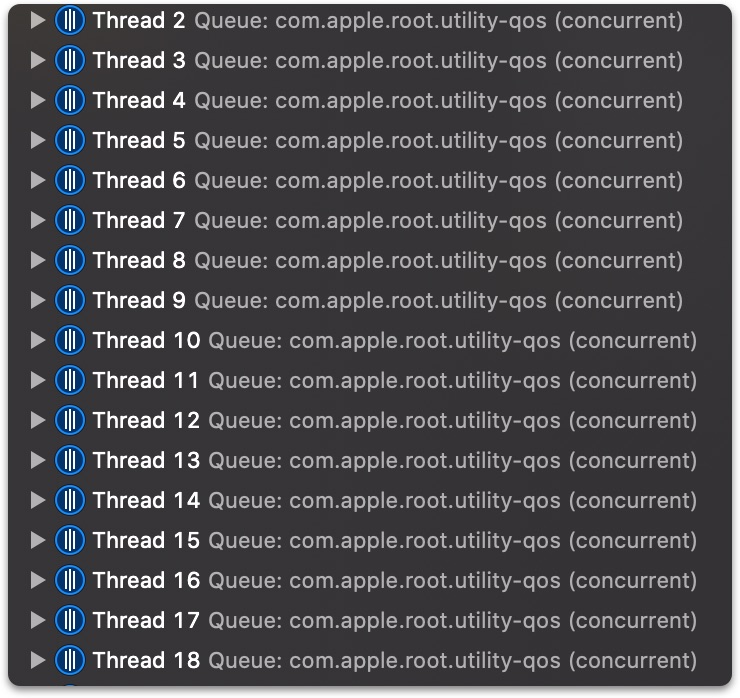
If we pause our application:

When you dispatch_async a block onto a concurrent queue, GCD will attempt to find an idle thread in its thread pool to run the block on. If it can’t find an idle thread, it will have to create a new thread for the work item. Quickly dispatching blocks to a concurrent queue could leads to quickly creating new threads.
Remember that:
- Creating threads doesn’t come for free. If the block of work you’re submitting is small (< 1ms), creating a new thread would be wasteful in terms of switching execution contexts, CPU cycles and memory dirtying.
- GCD will happily keep on creating threads for you, possibly leading to thread explosion.
In general, you should always start with a limited number of serial queues, each representing a sub-component of your app (DB queue, text processing queue, etc..). For smaller objects that have their own serial dispatch queue, target one of the sub-component queues using dispatch_set_target_queue.
Only if you hit a bottleneck that can be solved by additional concurrency, use concurrent queues that you create yourself (not using dispatch_get_global_queue), and consider using dispatch_apply.
A note on dispatch_get_global_queue:
The concurrent queues you get from dispatch_get_global_queue are bad at forwarding QoS information to the system and should be avoided.
A quote by libdispatch’ Pierre Habouzit:
dispatch_get_global_queue()is in practice one of the worst things that the dispatch API provides, because despite all the best efforts of the runtime, there aren’t enough information at runtime about your operations/actors/… to understand what your intent is and optimize for it..
For a more detailed overview of libdispatch efficiency tips, check out this excellent compilation.
3) It might not be as bad as it looks
So you’ve tried to optimize memory usage as much as possible, but even then, after using your app for a while, memory usage stays high.
Don’t fret, some system components will only free up memory when they receive a memory warning.
For example, UICollectionView reacts to -didReceiveMemoryWarning (as of iOS 13), purging its reuse queue from memory in a low memory scenario.
To simulate a memory warning:
- In the iOS Simulator, use the
Simulate Memory Warningmenu item. - On a test device, call the private API (don’t submit to the App Store with this):
[[UIApplication sharedApplication] performSelector:@selector(_performMemoryWarning)];
4) Avoid using dispatch_semaphore_t to wait for asynchronous work
Here’s a common anti-pattern:
let sem = DispatchSemaphore(value: 0)
makeAsyncCall {
	sem.signal()
}
sem.wait()
The problem is that priority info is not propagated to the other thread/process where the work initiated by makeAsyncCall will be done, and could lead to priority inversions:
- Say calling
makeAsyncCallfrom the main queue dispatches a workload onto a DB queue of QoSQOS_CLASS_UTILITY. - The DB queue’s QoS will be boosted to
QOS_CLASS_USER_INITIATEDthanks tomakeAsyncCallcallingdispatch_asyncfrom the main queue. - Blocking the main queue with the semaphore means that it’s stuck waiting for work that’s run at
QOS_CLASS_USER_INITIATED(which is lower than the main queue’sQOS_CLASS_USER_INTERACTIVE), hence the priority inversion.
A side note on XPC:
If you are already using XPC (on macOS, or if you’re using NSFileProviderService), and you want to make synchronous calls, avoid using semaphores, and instead send your messages to a synchronous proxy using:
-[NSXPCConnection synchronousRemoteObjectProxyWithErrorHandler:].
5) Don’t use UIView tags
It’s a bad practice and an indication of code smell. It’s also bad for performance.
I have recently worked with code, that, once a view is tapped, changes its subviews’ colors depending on their tag value.
UIKit implements tags using objc_get/setAssociatedObject(), meaning that every time you set or get a tag, you’re doing a dictionary lookup, which in a hot loop may show up in Instruments:

-[UIView tag] consuming precious milliseconds when processing touch events.Edit:
This is micro-optimization at best. My takeaways were that 1) surprisingly -[UIView tag] is based on associated objects, and 2) it will only have any impact if used heavily in performance sensitive code.
Parting Thoughts
I hope you’ve learned something new today reading these tips. As always, make sure you measure before you jump to performance tweaking.
Have questions? Got more performance tips to share? Let me know in the comments!
Plug
You can check out my neat Mac utilities here.
Edits
- Thanks to Paul Hudson for correcting the place to nilify your label contents when used in
UICollectionView/UITableView.